Concept to Cash cycle (C3) in #Agile

  1. Idea
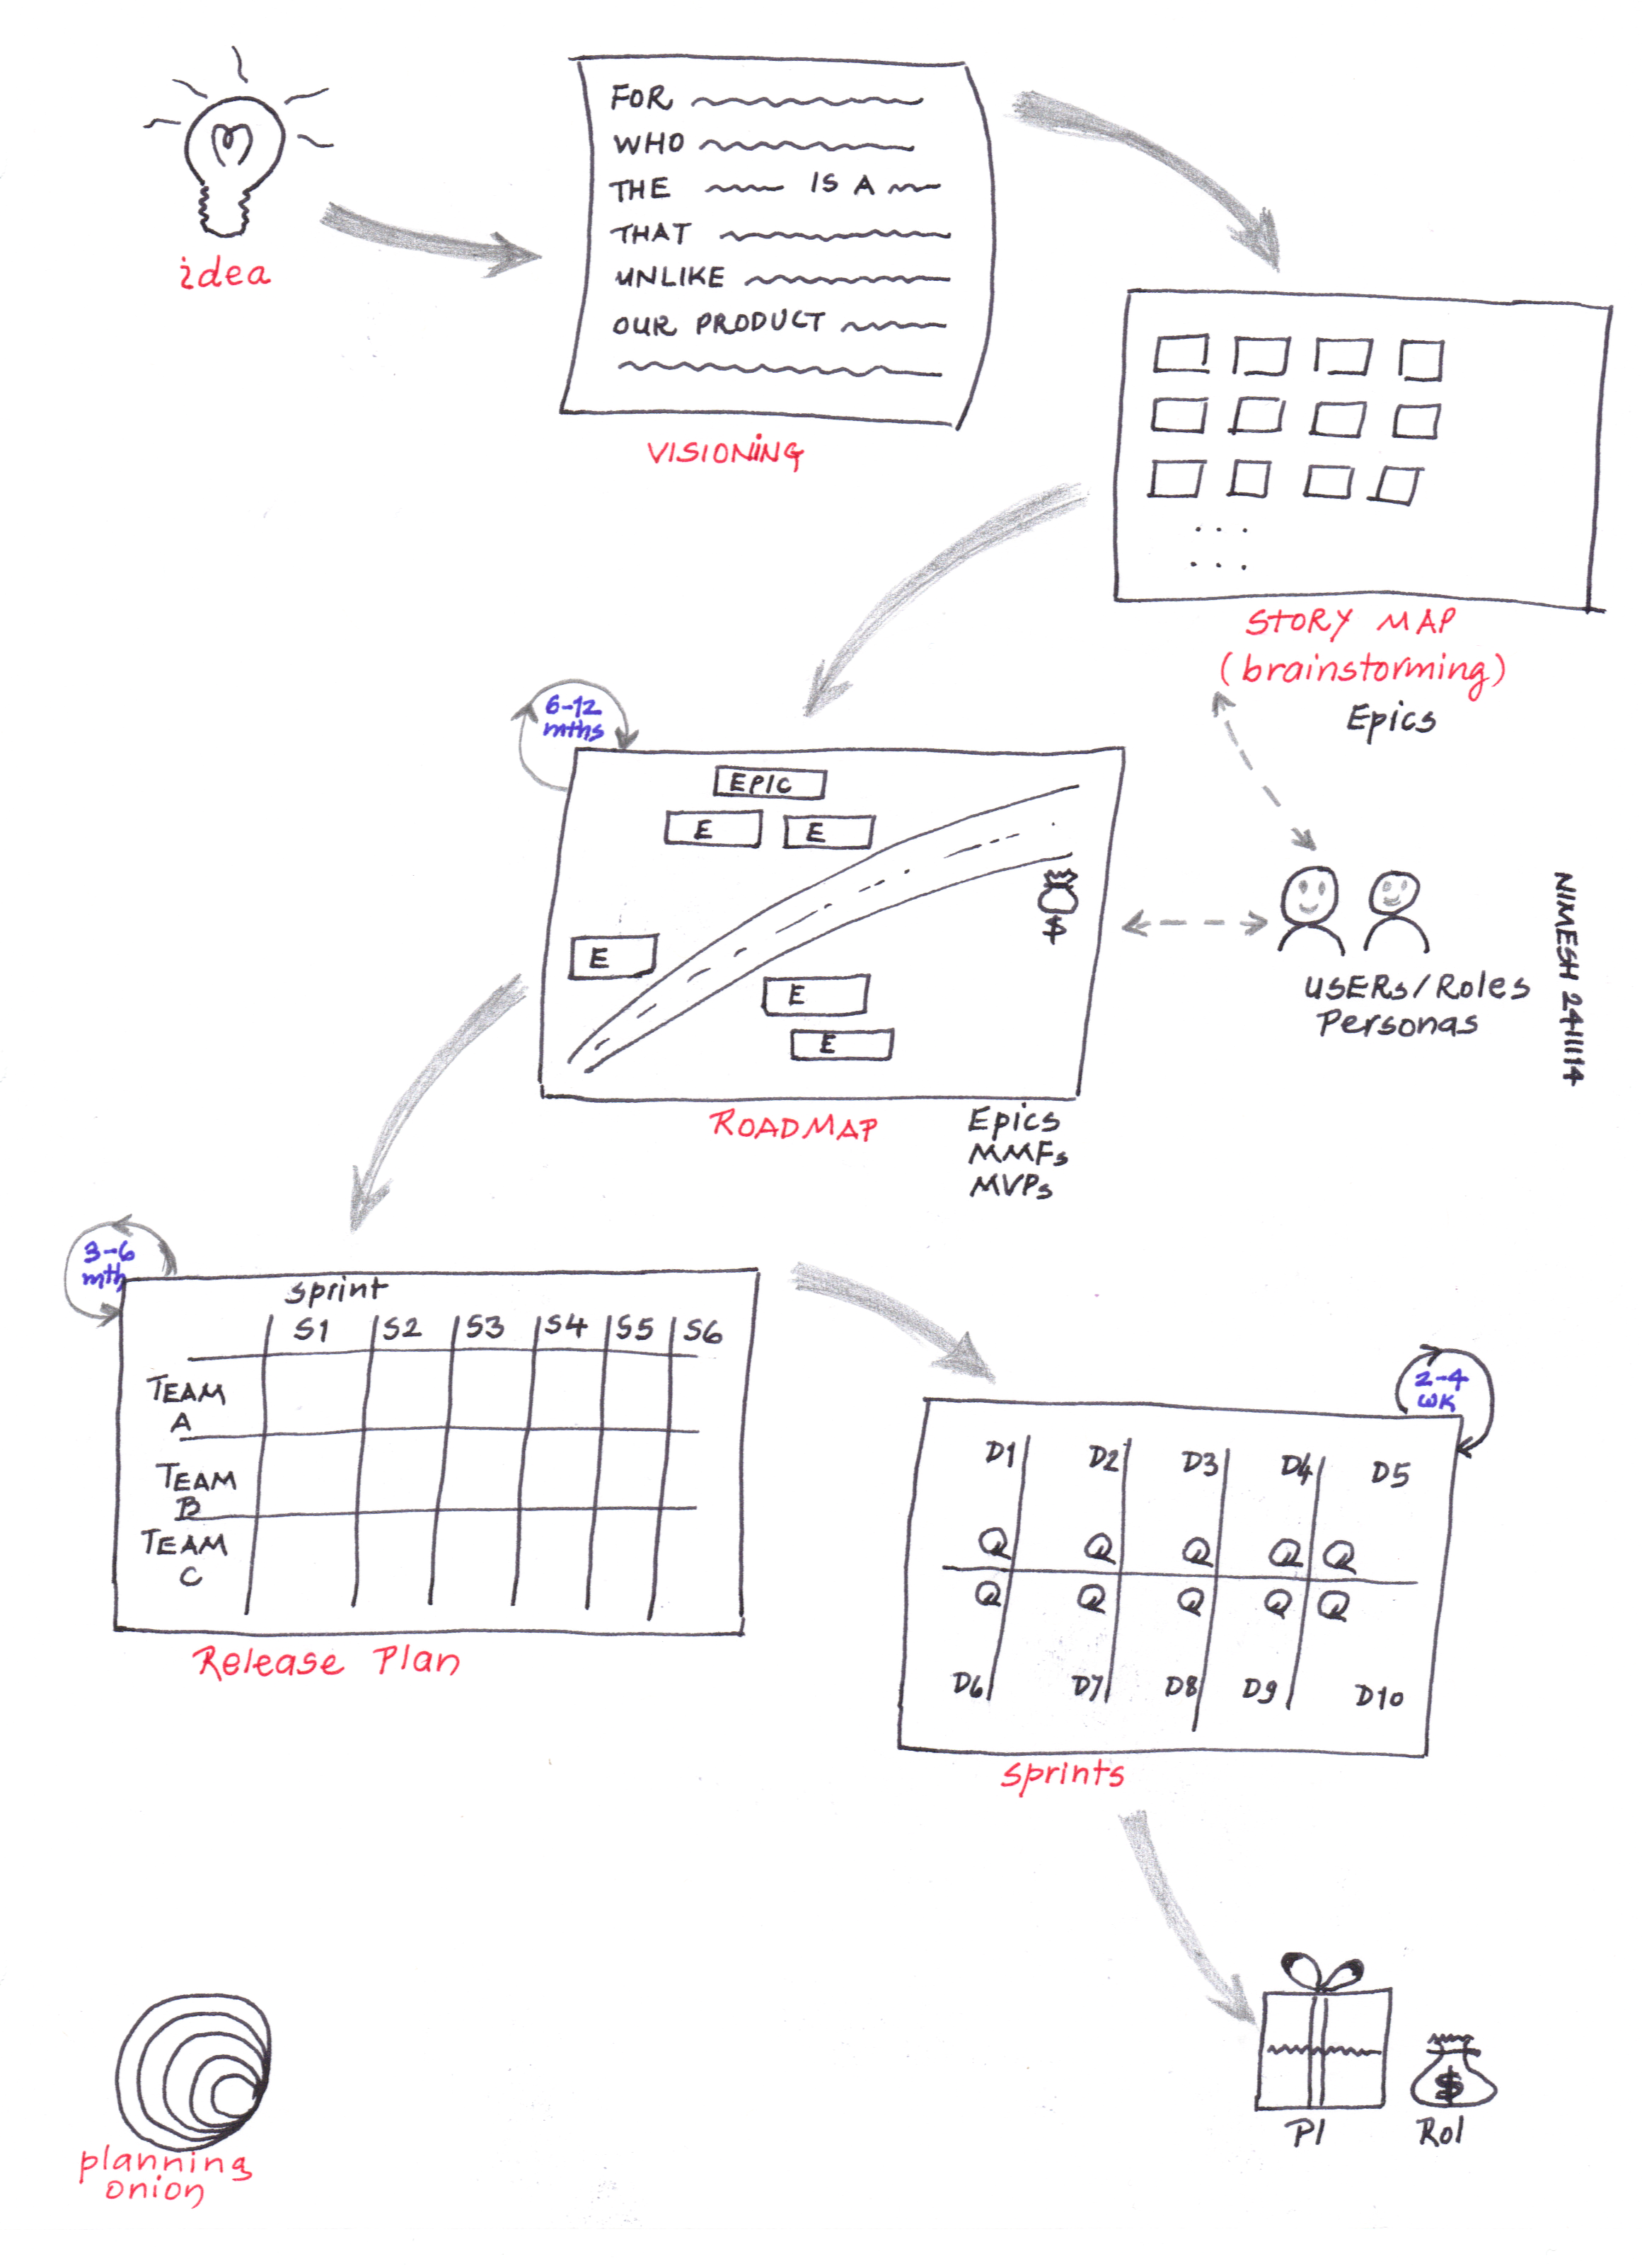
    Everything stats with an idea!  It could be an idea for a new product/service offering, or it could be a new market opportunity that you want to pursue, or it could be that you want to fix all the ‘holes’ in your existing product in order to gain better market share. Bottom line is that it all starts with a seed that we call Idea!
  2. Visioning
    Remember, you are not alone working on this idea! You will have teams working on this idea to drive it towards (becoming) a reality. You should be able to convey your vision about the product/service. We use this special format to describe your vision.
  3. Story mapping / brainstorming
    Now, armed with your Vision statement, you can start pulling all the right parties, the stake holders into conversation. You can lead a brainstorming session to uncover, unearth the work that needs to be completed in order to make this vision a reality. Don’t overwhelm yourself with lot of details. Key here is to stay at 50K ft and capture high level (slices of) work that would need to be completed (don’t worry about how, when, who does it. For now, the focus is on WHAT.
  4. Roadmap
    Now that we know what work needs to be completed (based on the Story mapping exercise), we can start putting them together on a roadmap that will help us make the product a reality. At this point, we want to focus on next 6 to 12 months, and create a product road map; what features would be built, and when we would like to release them to the market. As we do this, stay focused on creating value with each product increment that we push to market.
  5. Release Plan
    With the roadmap in place, we can start pulling in all the teams that would be working on them. Complete some dependency analysis, identify all the teams, and get them into release planning session. Here, we are focusing on next two to three months, and what product increment we can work on and get it out to market. All the teams can discuss these features and functionalities, what it will take (effort) for them to make it a reality, what are the dependencies, and how they may impact the “Push to Production” effort. At the end of this session, these teams come out with an intended plan of HOW they will build this product increment.
  6. Sprints / Iterations
    Based on the intended plan that came out of the release planning session, teams go into individual sprints, get into more details as to what tasks needs to be completed. Here, we focus on next two to three weeks at a time.
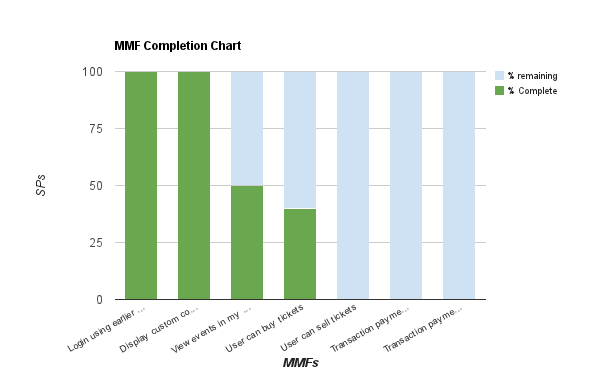
The key to success here is not to get hung up on getting the product to be ‘perfect’ before you go to market. WE focus on creating a version, an increment of the (ideal) product and push it to market; identify the minimum viable product (MVP) with which we can go to market. And, then repeat this cycle on a smaller feature sets, smaller increment of the product (that builds on the increment that we released to market earlier).
How long is your Concept2Cash cycle? How long does it take for your organization to take an idea to market?
Would you want to shorten this, want to increase your Idea2Market speed?
#Agile can help, I can help! Get in touch with me and we can shorten this cycle for your organization.
Read More

#Scrum flower

Please accept this beautiful flower to start your day; I like to call it #Scrum flower. Look under the ‘pretty packaging’ and you will find these ingredients:
  • Team as we know is in the center of Scrum. It is all about team!
  • This centerpiece is surrounded by the five values of scrum: Focus, Openness, Respect, Courage, and Commitment
  • And, all these is supported (the stem, and the leaves being) the three pillars of Scrum: Inspection, Adaptation, and Transparency

As I said, please accept this beautiful flower to start your day, and be generous to pass it on!

Read More

#agileReleasePlanning wall

Each column represents a Sprint in the release cycle. Each row represents a team that will be participating in this release planning exercise.
Agile Release Planning Wall


Based on the history, make up of the teams, and what is needed in the functionality, the Chief Product Owner (CPO) may decided to pre-assign some of the work slices (open for discussion and negotiations with the team later on).

Read More

Agile Data Warehouse series: What it is? – the workflow

In my previous post , I announced my intention on writing a series of posts talking about my recent experience with data warehouse build out in agile transformation of EDS for a Fortune 100 company. Let’s continue our discussion on this interesting topic. 

So, what exactly it is? What do I mean by agile data warehouse build out? 
 
First of all, let’s talk about Data Warehouse in general. A data warehouse initiative typically involves building out data structures in the enterprise data model, pulling data from multiple sources, doing some (data) transformation, and then ‘parking’ them into the target data structure. Sounds about right? 
 
At a high level, at least, this is the work flow for a data warehouse build out. To get to next level of details, your data warehouse build out includes:
  • Identifying the data elements and sources for that data
  • Coming up with logical data model that will support the business’s analytical needs
  • Often, getting this logical model; or as technical teams would say LDM (Logical data model) approved through some governance body in the organization
  • Getting the physical data structures, PDM (Physical data model) created
  • Extracting and transforming data from various sources to load into the physical data structures
To summarize, a typical data warehouse build out contains of following work flow (of events):

Typical workflow for a Data Warehouse build out
[Please note that we will be modifying this as we discuss the topic further]
Now, let’s talk about Agile data warehouse (ADW).  By ADW, I mean:
  • We build the data warehouse in increments
  • Delivering Potential shippable increment (PSI) of the data warehouse at a regular frequency [and not have customers waiting to get the data warehouse as one big-bang delivery]
  • Involving customers through the build process 
  • Understanding customers, and their needs – what are the business reasons for them to request this data warehouse
  • Focus on creating customer value incrementally, and not the technologies or the implementation of it. Shift your focus from technology (and data elements, data structures, primary key, foreign key, etc.) to customers needs. 

Often times data folks are so focused on their tables and primary keys that they start driving the build out from that vantage point only 🙁

Let the customers’ need be your guiding beacon! 
 
[Next post: Know thy customer!]
 
Read More

Agile Data Warehouse series: What it is? – the workflow

In my previous post , I announced my intention on writing a series of posts talking about my recent experience with data warehouse build out in agile transformation of EDS for a Fortune 100 company. Let’s continue our discussion on this interesting topic. 

So, what exactly it is? What do I mean by agile data warehouse build out? 

First of all, let’s talk about Data Warehouse in general. A data warehouse initiative typically involves building out data structures in the enterprise data model, pulling data from multiple sources, doing some (data) transformation, and then ‘parking’ them into the target data structure. Sounds about right? 

At a high level, at least, this is the work flow for a data warehouse build out. To get to next level of details, your data warehouse build out includes:
  • Identifying the data elements and sources for that data
  • Coming up with logical data model that will support the business’s analytical needs
  • Often, getting this logical model; or as technical teams would say LDM (Logical data model) approved through some governance body in the organization
  • Getting the physical data structures, PDM (Physical data model) created
  • Extracting and transforming data from various sources to load into the physical data structures
To summarize, a typical data warehouse build out contains of following work flow (of events):

Typical workflow for a Data Warehouse build out
[Please note that we will be modifying this as we discuss the topic further]


Now, let’s talk about Agile data warehouse (ADW).  By ADW, I mean:
  • We build the data warehouse in increments
  • Delivering Potential shippable increment (PSI) of the data warehouse at a regular frequency [and not have customers waiting to get the data warehouse as one big-bang delivery]
  • Involving customers through the build process 
  • Understanding customers, and their needs – what are the business reasons for them to request this data warehouse
  • Focus on creating customer value incrementally, and not the technologies or the implementation of it. Shift your focus from technology (and data elements, data structures, primary key, foreign key, etc.) to customers needs. 

Often times data folks are so focused on their tables and primary keys that they start driving the build out from that vantage point only 🙁


Let the customers’ need be your guiding beacon! 

[Next post: Know thy customer!]

Read More

Agile Data Warehouse series: Intro

I have been involved in agile transformation at a Fortune 100 company, specifically in their EDS division. EDS being a central steward of all the data warehouse the company uses, it has been a challenge to rollout agile in this centralized group. In a series of articles, I will talk about my experience of agile rollout in EDS and data warehouse build out, the challenges we faced, and the ‘model’ that could be used. My hope is this series of articles will help you get a ‘head start’ when you have to work in such a situation.

This series of artless will include:

  • What it is – what do I mean by agile data warehouse?
  • Challenges agile teams face in an enterprise
  • Patterns for writing User Stories: Different ways of Slicing the work
  • Agile model that helps us develop and deliver data warehouse incrementally, delivering value earlier, and driving RoI for our customers; internal and external.

There is no organization that can live (and prosper) without data warehouse. Every organization is using data warehouse (on a smaller scale, perhaps) to house relevant data and use it to their advantages.

Look forward to ‘seeing’ you all here in this series.

[Next post: What it is? – the agile data warehouse]

Read More

Feature burn up / completion chart

MMFs: the Minimum, Marketable, Features


As I describe in my book, Agile Release Planning, an MMF is a group of minimum functionality that we can release to customers. By ‘marketable’ we mean that the functionality can be released to customers for their use, and thus the word ‘marketable’! So, by definition, MMFs must bring significant value to customers.

As MMFs are of most value to customer, it makes sense to track the progress we make on them. Feature Burnup chart or Feature completion chart is an invaluable tool in your toolkit. It is simple yet very effective chart that you can use to convey progress (or lack of progress) that you are making on various work slices that are of interest to business.

Here is an example for the sample project that I mention in my book:

In this chart we are plotting MMFs on x-axis; in the order of priority, with highest priority item on the left, and lowest priority item on the right. As you can see, it conveys the progress we have made so far on each MMF as well as what MMFs are complete vs. what MMFs are being worked on actively by the team.


If you see progress on right (lower priority MMFs), you should question why team is working on them. This might be legitimate, but you at least want to ask and get confirmation for a valid reason to work on lower priority items.

Another variation of this chart is to use percentage complete as shown in example below.


The previous chart (using SPs) gives you relative complexity that you can use to compare the effort involved among MMFs.

As I said, this chart is simple yet very effective. And, I am making it even more simple for you to create it. You can download a template and create this chart in just few clicks.

Business scenarios where I would use this chart:

  • My director is asking for status on different slices of workin my project
  • Why I see activity on the lowest priority MMFs
  • What progress we are making, and on what pieces of the project

I have infact asked my directors to always have this chart handy. I recommend that all product owners carry this as well.

You should update it at end of every sprint. You want to share this with your stakeholders at the sprint review. And, also attach impediment list to this chart, especially when you are not making progress on some MMFs.

Read More

Lessons from the battle front..

I recently presented at Annual Scrum gathering in Chicago, IL on April 14, 2008 on this topic. In this presentation we discussed opportunities and challenges of corporate roll out of Agile and Scrum. I am happy to inform that the presentation was a great success. There was lot of interaction from the participants during our presentation. This (participant interaction) is always a a good sign! I also got to meet well-known players in the Scrum landscape as well. All in all, it was very rewarding experience.

Click here to access our presentation material posted on Scrum Alliance website.

Please don’t hesitate to contact me if I can be of any further help.
Thanks.

Read More