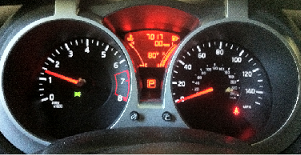
We all are familiar with these dials! This is a picture of my car-dashboard, giving me reading on various aspects of my car and my driving (habits). Do you have a dashboard that you use to navigate your Agile projects through the real life challenges? If you do have it, what are the dials you use on it?
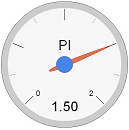
If you don’t have the dashboard for your project, at a minimum, I would strongly suggest of posting this dial (shown below) to show the productivity of your team.
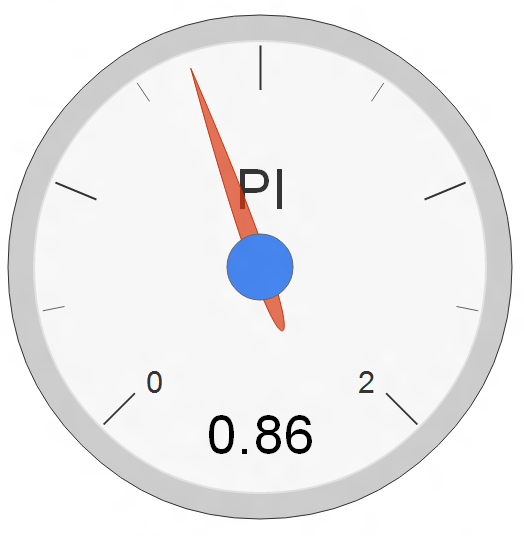
Essentially, it is tracking what Value you are creating (BV) against all the Effort (SP) you are putting into it. As mentioned on Wiki, Productivity is a measure of the efficiency of production. Productivity is a ratio of production output to what is required to produce it (inputs).1
You can consider it your team’s Productivity Index (PI).
I like to chart it on a scale of Zero (0) to Two (2). If your team stays on the left of the dial, your team needs to work on improving the velocity and productivity. On the other hand, if your team stays on the right side of the dial, your team is producing more than what it is taking in. If you are staying somewhere in the middle of the dial, your team is breaking even.
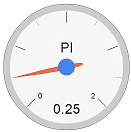 Team “Silver”
|
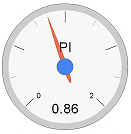 Team “Gold”
|
 Team “Platinum”
|
Which team would you rather have? Which team would be proud of coaching?
Notes:
BV=Business Value
SP=Story Points
PI=Productivity Index